d. View Metrics in CloudWatch
ParallelCluster automatically creates a CloudWatch dashboard with metrics for each cluster. In this section, you will add a custom Cloudwatch metric to the existing dashboard. You will do so using the AWS Python SDK to publish the custom CloudWatch metric, which captures the cost of the cluster’s compute nodes over time.
1. Upload the python script.
Copy the attached Python Script onto the cluster in a directory accessible by the headnode, such as /shared/. This python script calculates the total number of node minutes that have executed in the cluster, determines the cost per minute of the node instance type, and then publishes a total cost of the cluster’s compute nodes as a CloudWatch metric where we can view the results in a dashboard.
2. Create a wrapper shell script.
The scheduled script needs to reference the settings in /etc/profile for it to work in cron scheduler.
Therefore we will create a bash wrapper script that sources the settings, and then runs the python script we created above.
cat > publish_cw_cost_metric.sh << EOF
#!/bin/bash

source /etc/profile
python3 /shared/publish_cw_cost_metric.py
EOF
3. Make the wrapper shell and python scripts executable:
chmod 755 /shared/publish_cw_cost_metric.sh
chmod 755 /shared/publish_cw_cost_metric.py
4. Create a cron entry for the script.
Schedule the wrapper shell script to execute every minute so the dashboard is updated continuously using the command below:
cat > crontab_entry <<EOF
MAILTO=""
* * * * * /shared/publish_cw_cost_metric.sh
EOF
crontab crontab_entry
The cluster’s compute node cost data will now be published every minute to CloudWatch as a custom metric.
::::expand{header="[Optional Information] Additional details about Cron"}
Cron is a task scheduling daemon present in Linux distributions. Note that you have set MAILTO="" in
the cron entry to disable mail notification pop-ups in your terminal session.
::::
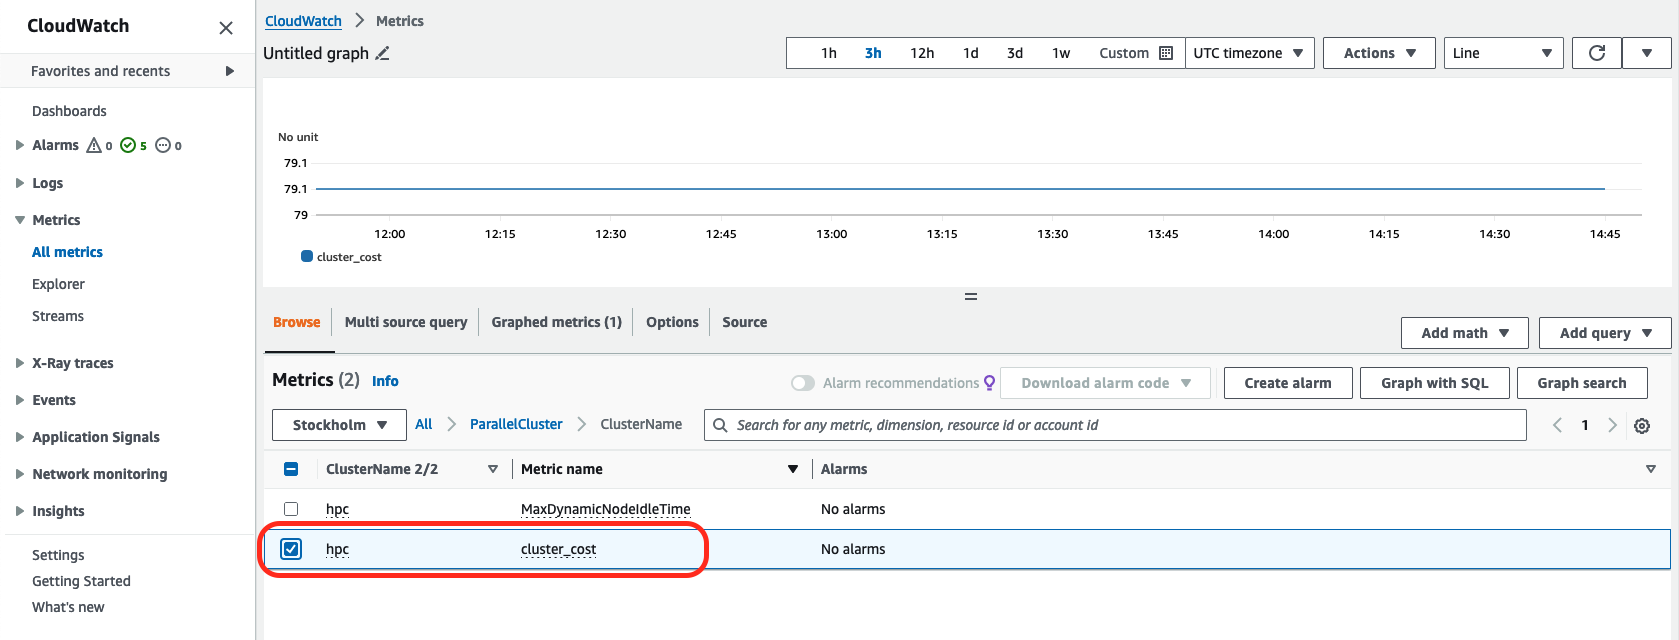
5. Observe the CloudWatch metric for cluster_cost.
Open the CloudWatch service in the AWS Console. Select Metrics > All Metrics > ParallelCluster > ClusterName.
Then select checkbox for the metric named cluster_cost to plot it. Note that it can take up to 5 minutes for metrics to be displayed in CloudWatch. Please wait until you see the cluster_cost metric in the CloudWatch console, then select cluster_cost.
6. Modify cluster_cost time period.
Select the Graphed metrics tab and modify the cluster_cost metric to show a period of one minute, as seen in the image below:
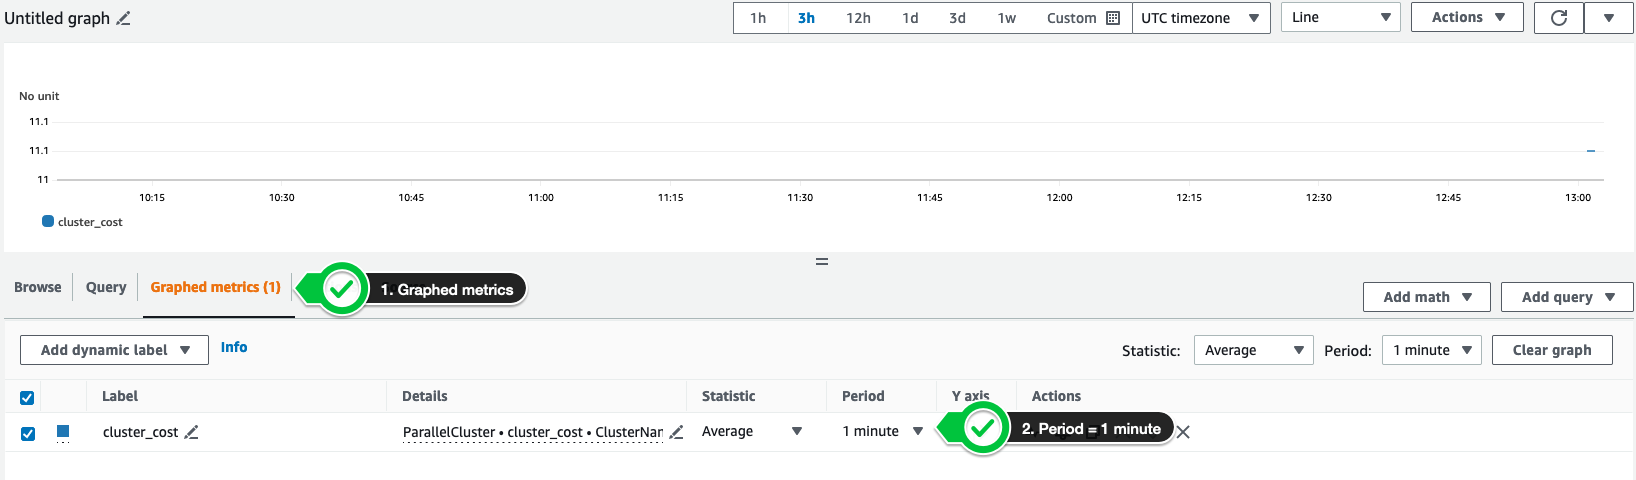 CloudWatch allows you to customize the way in which data is aggregated. In this lab, you have chosen a period of one minute because that is how frequently the custom metric data is published.
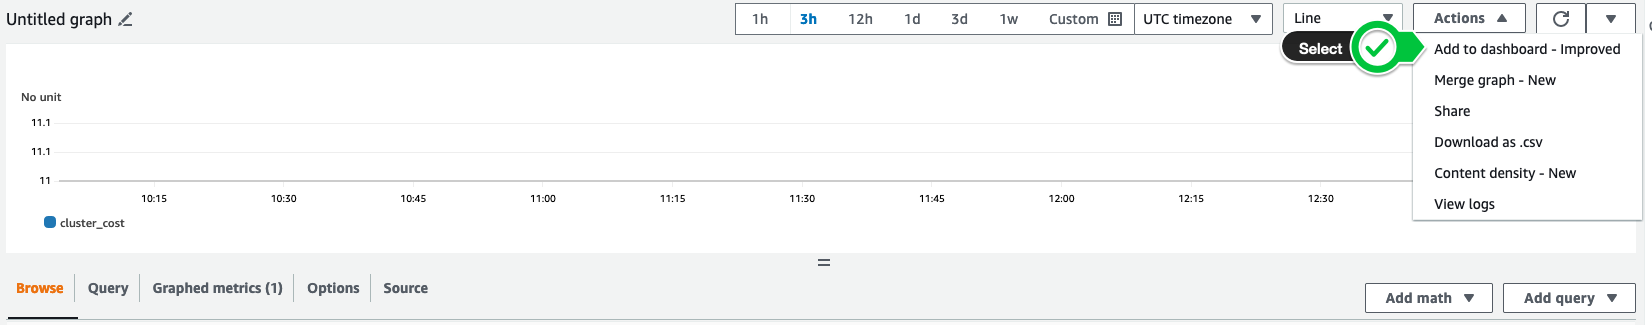
7. Add the cost graph to the dashboard.
The ParallelCluster CloudWatch dashboard is created as part of the standard ParallelCluster deployment for each cluster. You will add custom metric cost data to this dashboard to provide deeper insights into the overall health and cost of the cluster.
Select Actions and choose Add to Dashboard.
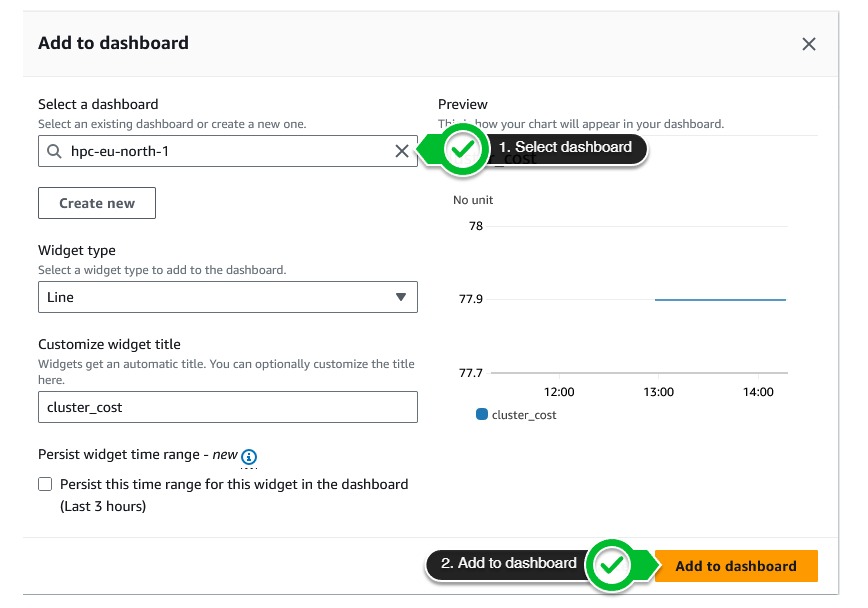
Then choose the dashboard for your cluster and select Add to Dashboard.
8. View the ParallelCluster Dashboard.
The cluster dashboard will now appear. Scroll to the bottom of the dashboard to view the cluster_cost graph.
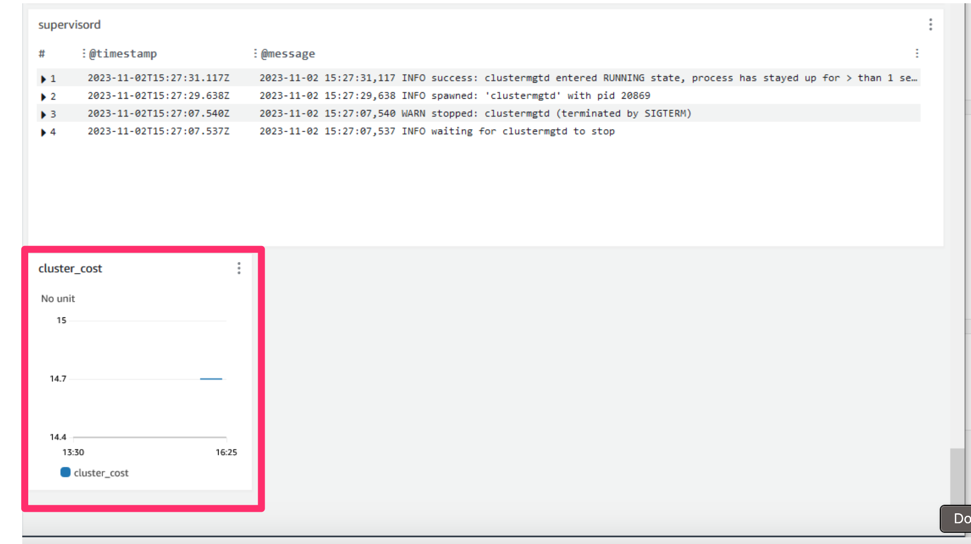
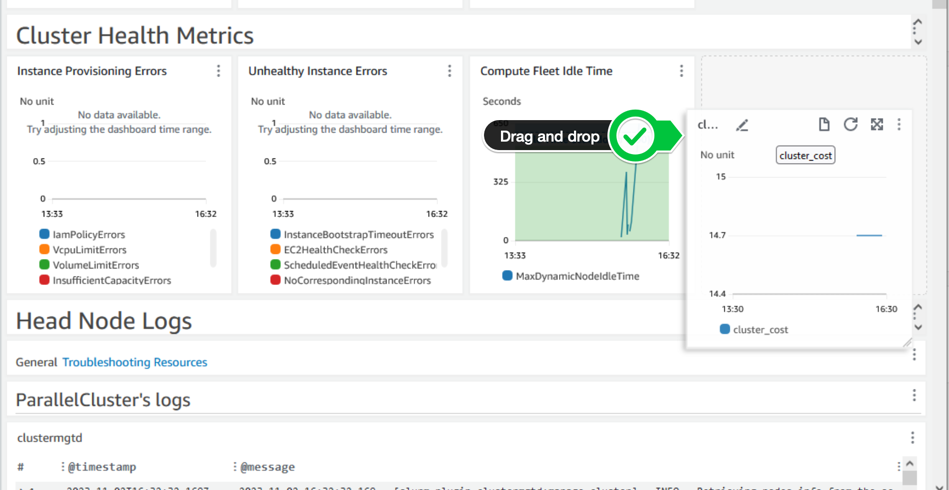
Move the cluster_cost graph to be under the “Cluster Health Metrics” section using the drag and drop functionality.
Hover your mouse over cluster_cost graph with your cursor, click, and drag the graph upwards to the “Cluster Health Metrics” section as seen in screenshot below:
Your dashboard will now look like the image below, where you can visualize your cluster cost data alongside other relevant cluster metrics and logs.
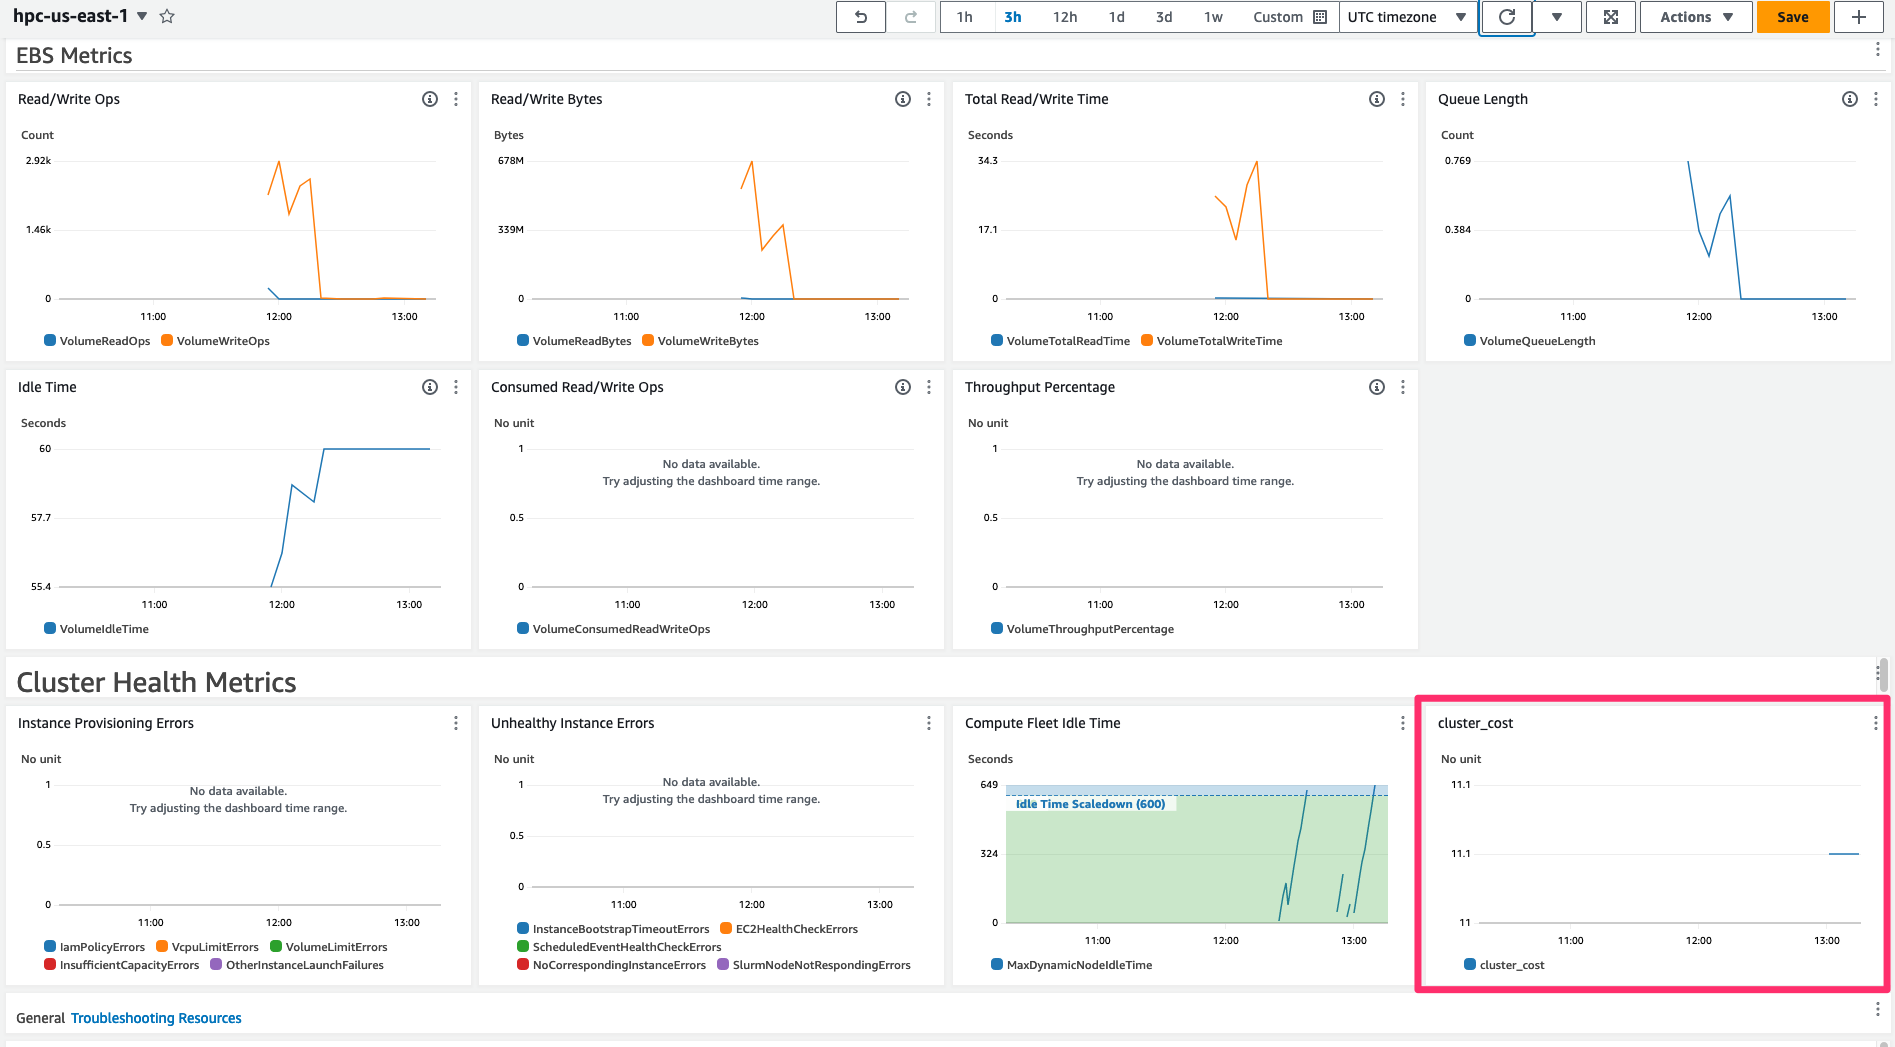
You have successfully created a CloudWatch Dashboard to visualize the cluster cost using a custom CloudWatch Metric. Please continue on to the next section.